![What is a customer journey map? The complete overview [examples + templates] What is a customer journey map? The complete overview [examples + templates]](https://cdn.sanity.io/images/9vhmlpns/production/5b4a414158a03d8c7cdd6df462d70731c13aeab7-524x393.webp) 06 Nov 2025
06 Nov 2025What is a customer journey map? The complete overview [examples + templates] What is a customer journey map? The complete overview [examples + templates]
By Admin • 06 Nov 2025
We've all been there — finding the perfect item online, adding it to cart, then getting distracted and abandoning it. With nearly 70% of online shopping carts abandoned, this pattern is incredibly common.
But why does it happen so consistently? It‘s not one thing, it’s a series of moments throughout the customer journey. Understanding that journey is everything, and that's where customer journey maps become invaluable.
While I can‘t promise you’ll predict every customer‘s move perfectly, I can show you how to build a map that tracks the critical moments that matter. A good customer journey map doesn’t just show you what customers are doing — it shows you why.
In this post, I‘ll walk you through my exact process for building customer journey maps that drive results. We’ll cover what a journey map is (and isn't), how to gather the right data, and a step-by-step framework to get it done right.
Let’s start with the basics. The customer journey is the series of interactions a customer has with a brand or product as they become aware of a pain point and make a purchase decision. While the buyer’s journey refers to the general process of arriving at a purchase, the customer journey refers to a buyer's purchasing experience with a specific company or service.
Customer Journey vs. Buyer Journey
I've noticed a lot of businesses get confused when it comes to understanding the difference between the customer journey and the buyer journey. It’s a common point of confusion, but the distinction is quite important.
Think of it this way:
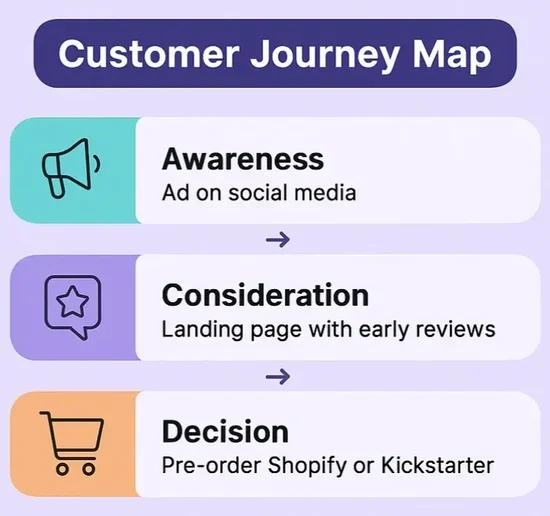
- The buyer's journey is the generic path someone takes. It’s universal. They realize they have a problem (Awareness), research solutions (Consideration), and choose one (Decision).
- The customer's journey is the specific path they take with your brand. It’s made up of the unique customer touchpoints you create to guide them through their buyer journey.
At Skybound, where I work now, our customer journey for a new comic book launch might start with an ad on social media (Awareness), lead to a landing page with early reviews (Consideration), and end with a pre-order Shopify or Kickstarter store (Decision). By mapping out that specific journey, we’re making sure every interaction is intentional and impactful, rather than just hoping for the best.
Your brand’s customer journey stages might look different, and that’s okay. What matters is starting with a clear plan. Let’s dig into how you can create a customer journey map to visualize it all.
What is a customer journey map?
A customer journey map is a visual representation of the customer's experience with a company. It also provides insight into the needs of potential customers at every stage of this journey and the factors that directly or indirectly motivate or hinder their progress.
By mapping your customer journey, you can use the information to improve the customer experience, increase conversions, and boost customer retention.
Keep in mind: The customer journey map is not to be confused with a UX journey map. Here’s the difference:
What is UX journey mapping?
A UX journey map represents how a customer experiences their journey toward a specific goal or completing a particular action. I’ve found this term is often used interchangeably with “customer journey map,” especially when the goal is a purchase.
However, UX journey mapping can also be used to map the journey towards other goals, like successfully using a new feature in a SaaS product for the first time. It’s a bit more granular.
Why is customer journey mapping important?
I’ve learned that the customer journey isn’t as simple as it looks. It’s easy to think: offer a product → customer buys. But honestly, it’s way more intricate.
Before a customer even knows about your product, they need to know they have a problem and that it needs solving. Sometimes you need to provide additional education to get them to that point.
Throughout their journey, they’ll hit different touchpoints. Maybe they’ll see a competitor’s ad, read a review, hop on a sales call, or try out a demo. Each of those interactions shapes how they feel about your brand.
Here’s something interesting: A Salesforce report found that 80% of customers value their experience with a company just as much as the product itself. That’s not a small number. It tells me that the how is just as important as the what.
By mapping out the customer journey, I’ve seen how it gives marketing, sales, and service teams a clear understanding of each stage. It reduces friction and leads to happier customers. And when we meet customer needs quickly? We see higher brand loyalty.
That’s huge, and it’s why I believe that understanding this journey is non-negotiable for any business that wants to grow.
What data is necessary for customer journey mapping?
When I’m mapping the customer journey, I focus on real data, not assumptions. I think of it in two main buckets: solicited data (what customers tell me directly) and unsolicited data (what their actions tell me).
As email strategist and customer journey strategist, Lindsay Hope explains, “You don’t want just any data. You need to dig deep to get to the actionable insights that show you exactly how your audience thinks, feels, and behaves at each stage of their journey. Unfortunately, most businesses get stuck because they think they know what their customers want. But assumptions ≠ reality. You have to collect the right data, so you’re working with facts, not guesses.”
Customer Surveys and Interviews
I find that asking customers directly through surveys or interviews reveals valuable insights into their experiences, pain points, and how they use the product. This is my go-to for solicited data because I can ask for it specifically.
In my experience, tools like Net Promoter Score (NPS) surveys, customer satisfaction (CSAT) scores, and even simple social media polls give me a pulse on how customers feel.
I few things I regularly do:
- Use post-purchase surveys to understand what they loved or struggled with during their buying journey.
- Talk with customers one-on-one to understand the deeper motivations behind their decisions.
- Talk with people who didn’t buy to understand why. This one can be difficult, but is often the most insightful.
While I love this type of customer information, it does have limitations. It relies on customers sharing their real opinions. In interviews, for example, people are often polite and might skew positive even if things could have gone better. And, a survey typically only reflects a specific touchpoint and may not reflect their entire experience.
Pro tip: Hope shares, ”When collecting solicited data, ask questions to highlight feelings and friction. (Not just what your customer did but why they made that choice.) For example: Instead of ‘What features did you like?’ ask ‘What made you confident this was the right solution?’”
Unsolicited Data
This is the other side of the coin. It’s the behavioral data customers leave behind without being asked. It’s often more quantitative and reveals what they actually do, not just what they say they do.
The data I find beneficial includes:
- Website behavior — the pages they view, the order of pages they click, bounce rates, and abandoned cart information.
- Email behavior — open rates, click rates, and other types of engagement.
- Social media mentions and reviews — public comments can help us identify areas for improvement and areas that delighted customers.
- Operational data — this is internal data like delivery delays or support ticket response times that help us improve the way we serve our customers.
For example, if we find that customers are abandoning their carts at the payment stage, we may identify long load times or our payment options as the causes of friction.
Recent Upload

What Is AWS and Why Businesses Use It
12 Feb 2026
Digital Growth: The Blueprint for Scaling in a C...
12 Jan 2026
5 Signs of Nervous System Dysregulation Every Me...
05 Nov 2025
Your Employees Aren’t Difficult. Their Nervous S...
05 Nov 2025
The Boundaries Paradox: Why Saying No Is the Mos...
05 Nov 2025